BRIEF SUMMARY:Here's a small preview of how we run design sprints and the type of problems we are able to find solutions for.In this particular example we are focused on helping Moody's commercial real estate (CRE) department improve their ability to identify risk and collateral needed for banks/brokers to make better decisions and assess if loan candidates are qualified. |
TASKS: |
ROLE(S):USER EXPERIENCE DESIGN USER INTERFACE DIGITAL STRATEGY TEAM MANAGEMENT |
SUMMARY:Here's a small preview of how we run design sprints and the type of problems we are able to find solutions for.VISIT LIVE: www.chronicle.com |
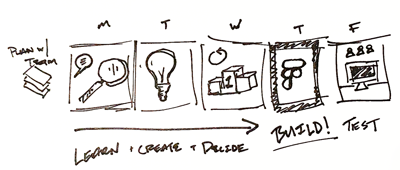
Pre-Sprint Planning
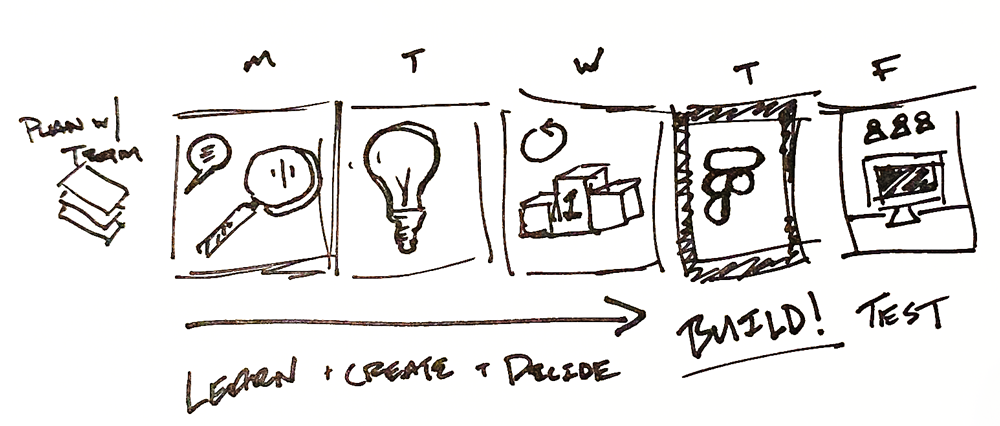
Day 1 - Understand
Result: By the conclusion of Day 1 we had landed on a specific target for the sprint. This is a crucial step where the team agrees on a focal point that is both challenging and manageable within the scope of the sprint. We decided that one of the greatest barries for users isnt gathering information (which was our assumption) but actually the interface used on the site for data entry.
"Users of our CRE Analytics Tools find it too complex and time-consuming to upload information. Leading to frustration with the product, innacurate results, or total abandonment of the process."
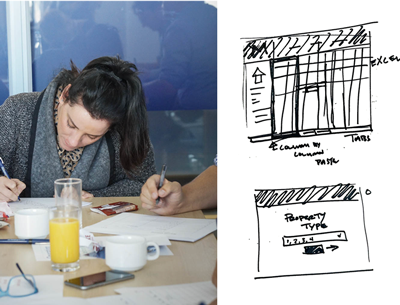
Day 2 - Ideation
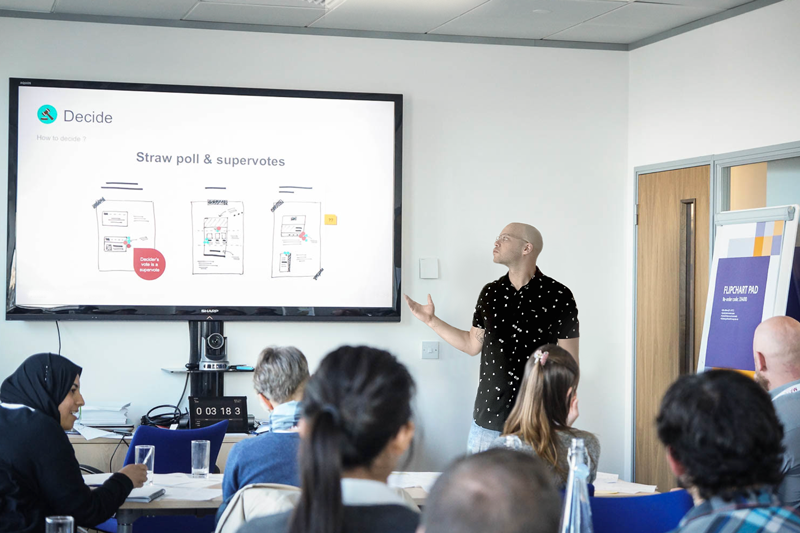
Day 3 - Define
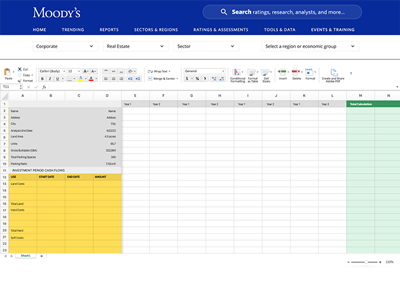
In the end, we decided we needed something that resembled an excel spreadsheet. Our interface would need to guide the user but also be flexible enough to allow for a wide array of data.
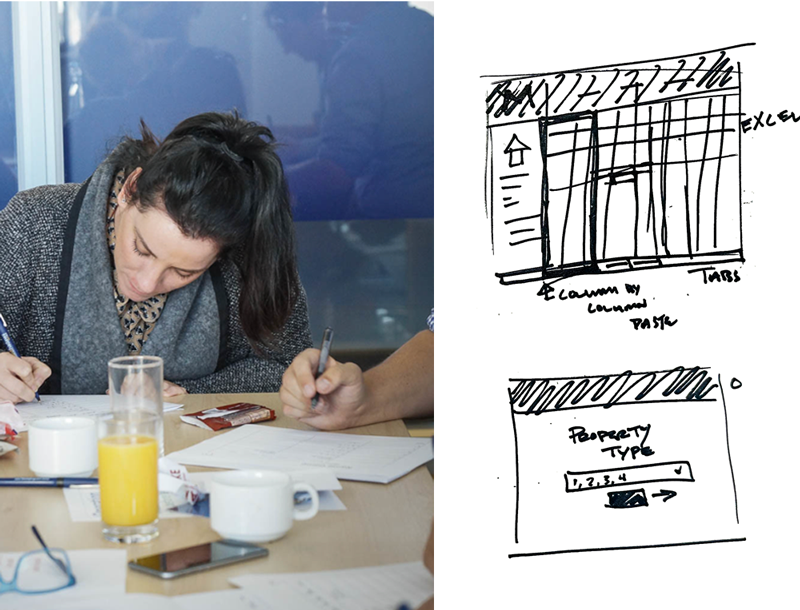
Day 4 - Protyping
Static information defined by Moody's analytics team is setup on the left with things like property descriptions and operating assesments. The middle area could be expanded and gave users the ablility to plugin information and add columns. Cells in the grid are programmed with a formula that will give results within the green area on the far-right side.

Day 5 - Testing

Results:
The insights gained from this testing phase were invaluable. They not only validated our design and development choices but also shed light on areas for further refinement. The constructive feedback received has laid down a clear path for the next steps for Moody's over the next several months to a year. We are now poised to fine-tune their CRE offering, aligning it even more closely with our users' needs and expectations, helping to solidifying Moody's position as a leader in the commercial real-estate sector.Pre-Sprint Planning
Day 1 - Understand
Result: By the conclusion of Day 1 we had landed on a specific target for the sprint. This is a crucial step where the team agrees on a focal point that is both challenging and manageable within the scope of the sprint. We decided that one of the greatest barries for users isnt gathering information (whiich was our assumption) but actually the interface used on the site for data entry.
"Users of our CRE Analytics Tools find it too complex and time-consuming to upload information. Leading to users receiving innacurate results or the inability to process claims completely."

Day 2 - Ideation
Day 3 - Define
In the end, we decided we needed something that resembled an excel spreadsheet. Our interface would need to guide the user but also be flexible enough to allow for a wide array of data.
Day 4 - Protyping
Set information defined by Moody's analytics team is setup on the left with things like property descriptions and operating assesments. The middle area could be expanded and gave users the ablility to plugin information and add columns. Cells are programmed with a formula that will give results within the green area on the far-right side.
Day 5 - Testing


|
1151 4th Street SW P. 703.389.0770 I'll be honest, Instagram |